Q2 2026 Market Outlook

Q2 of 2026 is shaping up much like we expected in our 2026 market outlook. We anticipated a generally constructive backdrop. With a market that earned the right to “chop around,” and an economy that leans toward growth despite noisy headlines.
The Markets So Far in 2026
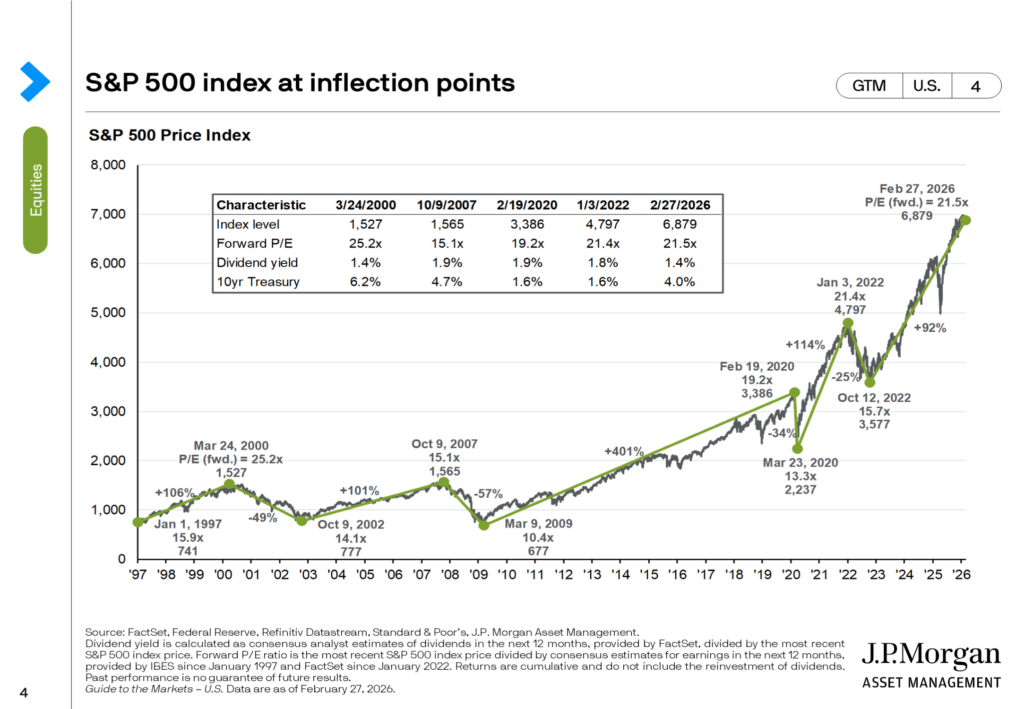
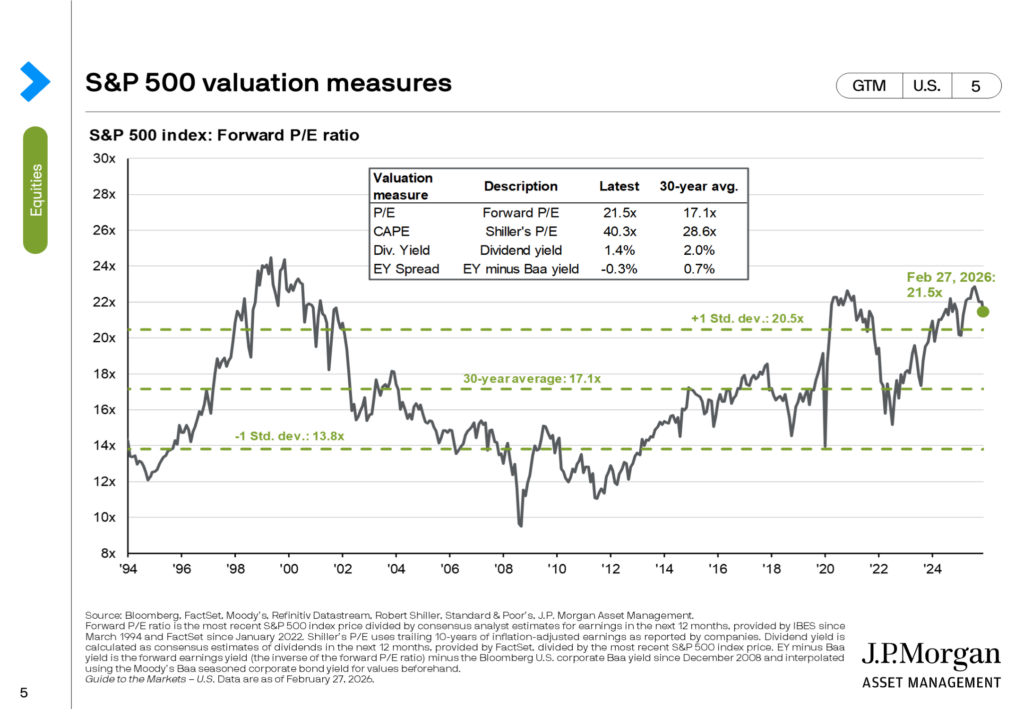
At end of February, the S&P 500 is roughly flat on the year at about +0.25%. Leadership is narrowing and many tech names are negative year‑to‑date. The index has largely moved sideways since last October. Fitting our view that markets needed time to digest the strong run that began last April. Guidance for 2027 earnings per share (EPS) were revised slightly higher. Even so, the forward price-to-earnings (P/E) ratios have compressed from about 22.4 to 21.5. This keeps our approximate 7% full‑year return target for 2026 intact12.
How This Lines Up with Our 2026 Outlook
Coming into 2026, we anticipated a potential early‑year pullback in the 7–10% range. This is a normal part of the market cycle, even in an otherwise bullish environment. So far, instead of a sharp sell‑off, we have seen more of a pause and consolidation phase with flat index‑level returns and internal rotation under the surface. Our base case remains a “very average but positive” year. With the S&P 500 returns centered around 7% and aggregate bonds in a similar mid‑single to high‑single‑digit range, supported by stable earnings and an eventual easing in rates.
Macro Check‑In: Inflation, Jobs, and Policy
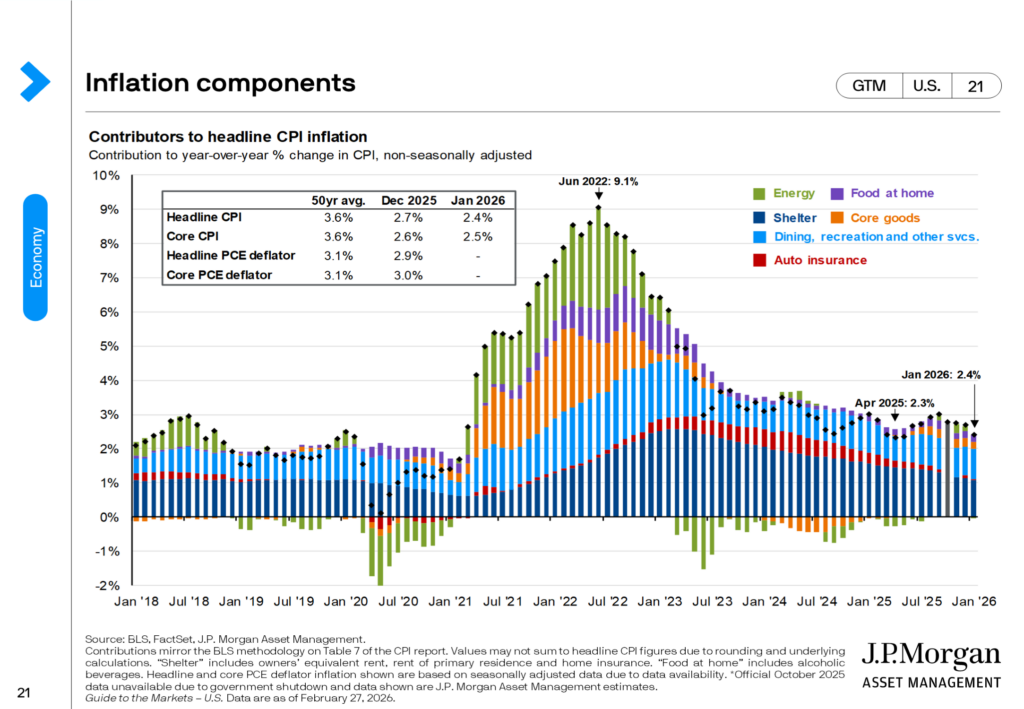
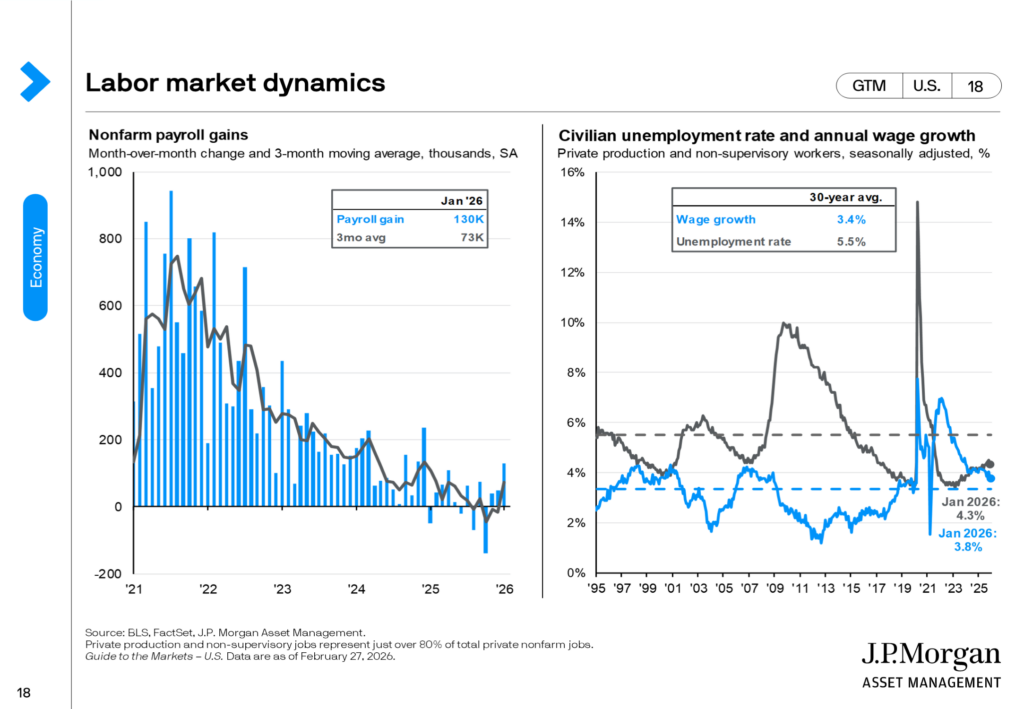
The three key macro pillars from our 2026 look‑ahead were improving inflation, a bottoming labor market, and supportive monetary policy. All these are generally tracking in line with expectations. As we cautioned, inflation has run slightly hotter in early 2026. However, the uptick has been smaller than many analysts feared and remains consistent with a broader downtrend over the year. Employment appears to have found a bottom. Though we still need a string of better data to confirm a turn to genuinely improving, especially given the long downtrend since 2021. The Federal Reserve has room to continue rate cuts later in 2026. Which should eventually ease pressure on consumers and businesses and provide a tailwind to both equities and bonds.
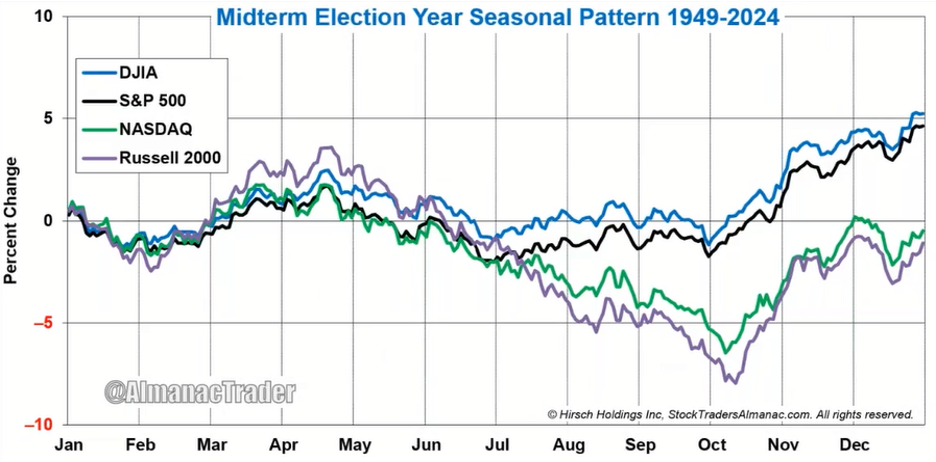
On the policy front, the ongoing DHS/government partial shutdown is acting as a modest drag on early‑year GDP growth. There is still risk moving forward of additional political “air pockets” such as further shutdowns or policy missteps. At the same time, a deadlocked Congress heading into midterm elections tends to limit major new policy swings. This has historically been a constructive backdrop for markets. With the launch of military action involving Iran, history suggests such events can be jarring in the short term but rarely derail U.S. markets unless the conflict reaches U.S. soil. As with any major geopolitical events, we will continue to watch as they unfold, and act as needed.
What This Means for Portfolios
From a portfolio standpoint, the data argues for staying the course on measured risk. Instead of de‑risking after a period of volatility and headlines. We continue to favor a modest tilt toward equities over bonds and cash. This view is grounded in stable forward earnings, an eventual Fed easing cycle, and an economy that is still expanding rather than contracting. The early innings of the AI and crypto adoption cycle, alongside broader technology investment, remain important secular tailwinds. Even if we see bouts of fear about an “AI bubble” or a pause in capex spending along the way. At the same time, we are keenly aware that employment trends, policy shocks, and sentiment swings can produce 7–10% pullbacks that feel worse in real time than they look in hindsight.
In this environment, the strategy from our 2026 outlook still applies: maintain proper risk allocation, be prepared for normal corrections within a longer bull cycle and adjust incrementally as the data evolves—not in reaction to every headline.
Disclosure: Matthew Finley is an investment adviser representative with Savvy Advisors, Inc. (“Savvy Advisors”). Savvy Advisors is an SEC registered investment advisor. The views and opinions expressed herein are those of the speakers and authors and do not necessarily reflect the views or positions of Savvy Advisors. Information contained herein has been obtained from sources believed to be reliable, but are not assured as to accuracy.
Resources
- Market Outlook 2026: Making Calculated Risks ↩︎
- The referenced return target is an estimate and represents a forward-looking statement based on current market expectations, assumptions, and the adviser’s investment outlook. It is provided for informational purposes only and does not represent a guarantee or projection of actual investment results. Targeted returns are hypothetical in nature and are subject to numerous risks, uncertainties, and market conditions that may cause actual results to differ materially. Past performance is not indicative of future results, and there can be no assurance that any investment objective or target return will be achieved. ↩︎
J.P. Morgan Asset Management, Guide to the Markets – U.S., Data as of January 30, 2026
Related Posts
-

Q3 2026 Market Outlook
Q2 of 2026 is shaping up better than we expected in our 2026 market outlook. Despite the noise around the globe and here in the U.S., based on CNBC-reported data, the S&P 500 is sitting roughly…
4 Min Read
By Matthew Finley
June 16, 2026 -

When Should You Sell RSUs? What to Consider Before You Decide
Key Takeaways: Restricted stock units (RSUs) can be one of the most valuable parts of your pay, but they also create a decision that many employees do not fully think through until shares have already vested.…
8 Min Read
By Matthew Nelson
May 11, 2026 -
How RSUs Work (and What They Mean for Your Taxes)
Key Takeaways: How RSUs Work at a High Level RSUs are a promise from your employer to deliver company shares in the future if you meet the terms of the plan. They are a form of…
8 Min ReadBy Matthew Nelson
May 8, 2026