Global Iranian Conflict: What It Means for Your Portfolio

We are now 24 days into the Iranian conflict, and while there are signs of a potential resolution, nothing is certain as of this writing. As with any major global event, our first step is to analyze the data, review history, and determine whether this changes our core outlook or portfolio positioning for the year.
At this point, it does not.
The Energy Shock and Its Ripple Effects
Strikes on Iran and the subsequent counteroffensive have taken an estimated 25% of global oil supply and a similar share of natural gas offline. Oil prices initially spiked sharply and remain significantly above pre-war levels, even after a modest pullback. While the U.S. is now a net energy exporter, higher global oil prices still feed through to shipping, manufacturing, and ultimately consumer prices.
We entered 2026 already expecting a small uptick in inflation early in the year, and this conflict has added to that pressure. Our view is that the impact should be transitory rather than the start of a new inflation regime, but it likely slows the timing of Federal Reserve rate cuts.
Rates, Flows, and the Global Spillover
Higher energy costs are particularly challenging for major importers in Asia and elsewhere, prompting some to raise cash by selling assets such as gold, silver, Treasuries, and equities. This selling has pushed U.S. Treasury yields higher, with the 10-year moving from roughly 3.96% at the end of February to the mid-4% range. This is back near levels seen last year. Higher long-term yields increase borrowing costs for households and businesses and represent an additional headwind we are monitoring.
In our 2026 outlook, we anticipated the 10-year drifting toward the mid-3% range by year-end as inflation eased and policy normalized. The recent move higher does not invalidate that path, but it may delay it.
What History Tells Us About Conflict and Markets
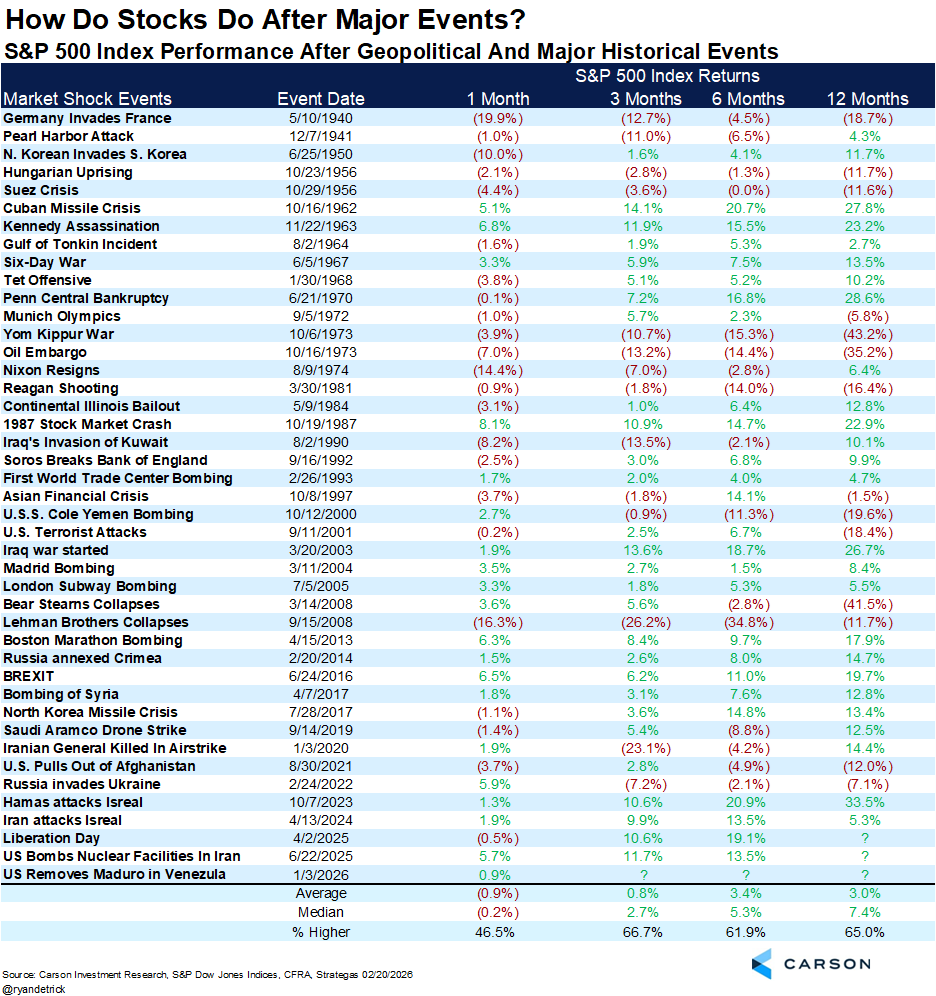
Historically, geopolitical shocks tend to cause short-term volatility rather than long-term damage when they occur against a backdrop of economic expansion. Looking across major conflicts since World War II, markets have often sold off in the initial days and weeks, then recovered as attention shifts back to earnings and growth. In many cases, the S&P 500 has been higher one year after the onset of conflict.
Looking at major geopolitical events since World War II, the data is instructive. The S&P 500 has historically declined by an average of about 4% in the first week of a major geopolitical shock, but recovered within the subsequent month in most cases. Looking further out, markets have been higher one year after the onset of conflict roughly 70% of the time, with average one-year returns in the high single digits.
This is consistent with where we believe we are today. We entered this episode in a growth (bull) market with solid corporate earnings, improving (though bumpy) inflation trends, and a labor market that appears closer to stabilizing than collapsing.
Where We Stand Today
U.S. markets are currently down mid-single-digits from early-2026 highs and modestly lower since the conflict began. This is well within the 7–10% pullback range we outlined as a normal possibility in our 2026 outlook. The decline is uncomfortable, but it does not currently signal a change to our base-case scenario of a “very average but positive” year for markets.
For now, we are:
- Maintaining our core 2026 outlook and portfolio design
- Keeping a modest tilt toward equities over bonds and cash, consistent with a still-expanding economy
- Closely monitoring the duration and intensity of the conflict, energy supply restoration, inflation data, Treasury yields, employment trends, and corporate earnings
If the conflict escalates materially, becomes prolonged, or triggers more persistent economic damage—particularly through energy and employment—we will reassess and consider appropriate risk-management steps. For now, the data continues to support staying the course within the disciplined framework.
Looking Forward
In the weeks ahead, we will be watching several key indicators:
- Oil supply restoration: How quickly damaged facilities come back online and whether any additional supply disruptions occur
- Inflation data: Whether the recent uptick proves transitory or begins to feed into persistent price pressures
- Treasury yields: Whether the spike in rates moderates as global risk appetite returns
- Employment trends: Continued signs that the labor market is stabilizing rather than deteriorating further
- Earnings reports: Whether companies maintain guidance and profitability in the face of higher energy costs
History suggests that geopolitical shocks create noise and short-term volatility, but they rarely change the long-term trajectory of markets when the underlying economy remains sound. Proper risk allocation allows us to weather these periods of uncertainty while positioning for recovery and eventual new highs. The path may be bumpier than we hoped when we entered 2026, but the destination—a positive but average year for markets—remains within reach.
As always, we are here to answer questions, provide context, and adjust course when the data warrants. Please do not hesitate to reach out if you would like to discuss your specific situation or have concerns about your portfolio.
Resources
Market Outlook 2026: Making Calculated Risks
10 Things Everyone Needs To Know About The US/Iran Conflict – Carson Group
Related Posts
-

Q3 2026 Market Outlook
Q2 of 2026 is shaping up better than we expected in our 2026 market outlook. Despite the noise around the globe and here in the U.S., based on CNBC-reported data, the S&P 500 is sitting roughly…
4 Min Read
By Matthew Finley
June 16, 2026 -

When Should You Sell RSUs? What to Consider Before You Decide
Key Takeaways: Restricted stock units (RSUs) can be one of the most valuable parts of your pay, but they also create a decision that many employees do not fully think through until shares have already vested.…
8 Min ReadBy Matthew Nelson
May 11, 2026 -
How RSUs Work (and What They Mean for Your Taxes)
Key Takeaways: How RSUs Work at a High Level RSUs are a promise from your employer to deliver company shares in the future if you meet the terms of the plan. They are a form of…
8 Min ReadBy Matthew Nelson
May 8, 2026